METHOD
We developed a systematic workflow, which includes collecting, expanding, and integrating modules, to construct a QS-based interaction database and network among drugs, microbes, and diseases (Figure 1). In the collecting module, we firstly curated various binding pairs between various drugs and different QS receptors, such as LasR and CviR. We also collected diverse associations among receptors, microbes, and diseases from as many researches as possible. Docking-based calculations for the reported cases were conducted to decide the free binding energy (FBE) cutoff, which formed a necessary basis for predicting potential binding of the other drugs and QS receptors. In the expanding module, we have analyzed the potential binding between eleven available QS receptors (LuxR, LasR, TraR, CviR, PqsR, QscR, YenR, SdiA, LsrB, LuxP, CckA) from diverse microbes and more than 8,000 drug molecules from the DrugBank database, and some cases of them were verified by the surface plasmon resonance (SPR) experiments. The docking-based cases with FBE being smaller than -6 kcal/mol were further processed in the integrating module, where the potential bindings were applied to constructed the QS-based drug-receptor network. Inspired by the network, we proposed a systematic framework including intricate drug-receptor-microbe-disease connections. Furthermore, we integrated the QS-based drug-receptor network and the reported receptor-microbe-disease associations together to be a QS-based drug-microbe-disease (QS-DMD) repository, which is the basis for the construction of the drug-receptor-microbe-disease interaction network.
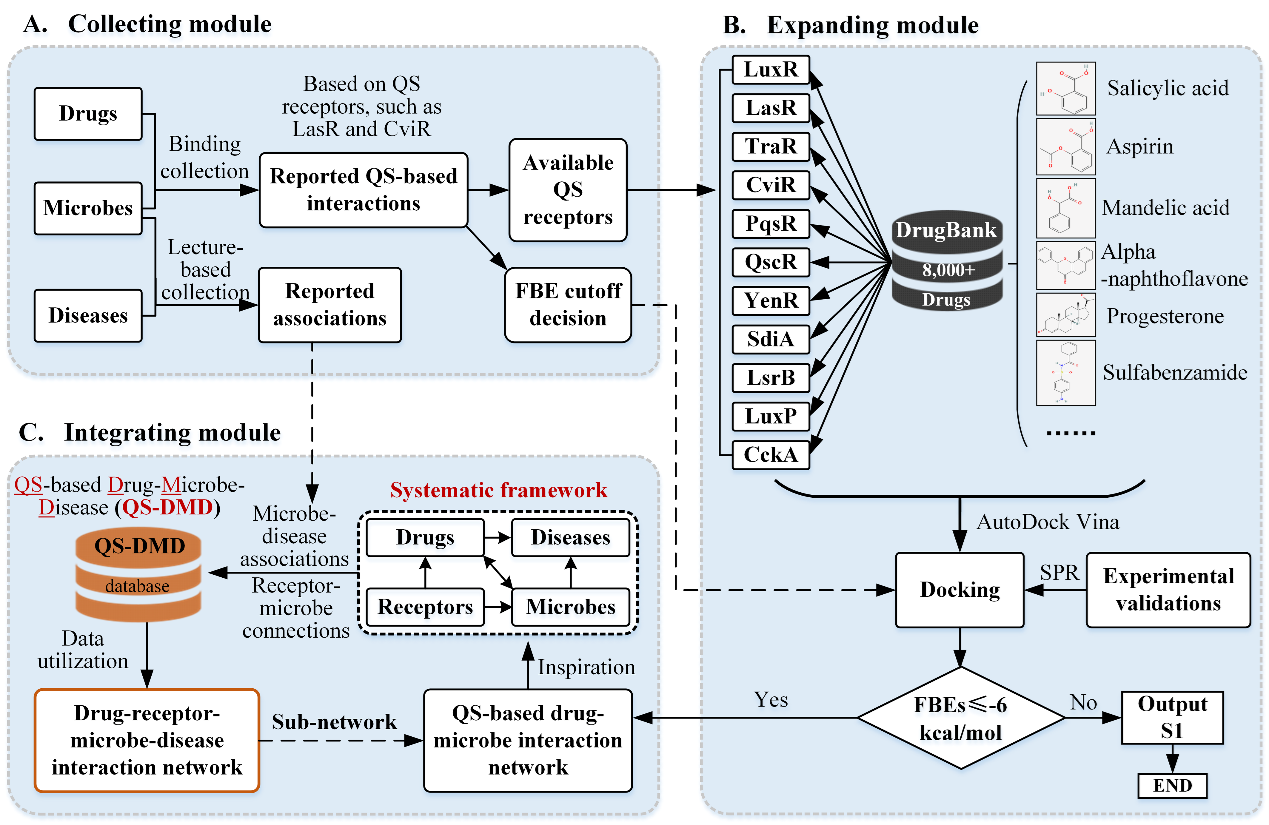
Figure 1. Schematic diagram of the workflow for the construction of QS-based drug-microbe-disease interaction network.
RESULT
We have collected examples of the reported binding of drugs to QS receptors. There are diverse drugs such as metformin, berberine, eugenol, salicylic acid, nifuroxazide, and chlorzoxazone can be bound to the QS receptor LasR. For example, compared with the positive control N-3-oxododecanoyl-homoserine lactone (3OC12HSL), there are highly similar binding sites (Tyr56, Trp60) for the berberine and 3OC12HSL when docking with LasR with AutoDock Vina (Figure 2A). With regard to the binding of drugs and another QS receptor CviR, there are same binding sites from Vina-based docking results (Tyr80) for positive control (N-Hexanoyl-L-Homoserine Lactone, C6HSL) and albendazole (Figure 2B). We conducted an analysis for the distribution of the free binding energies (FBE) of diverse QS receptors and various ligands, including original ligands (Figure 2C) and reported docking-validated drugs (Figure 2D). Combined with our previous study, we suggested that “-6 kcal/mol” can be also set as the cutoff to separate the binding and non-binding, which can be used to test the validity of Vina-based docking approach.
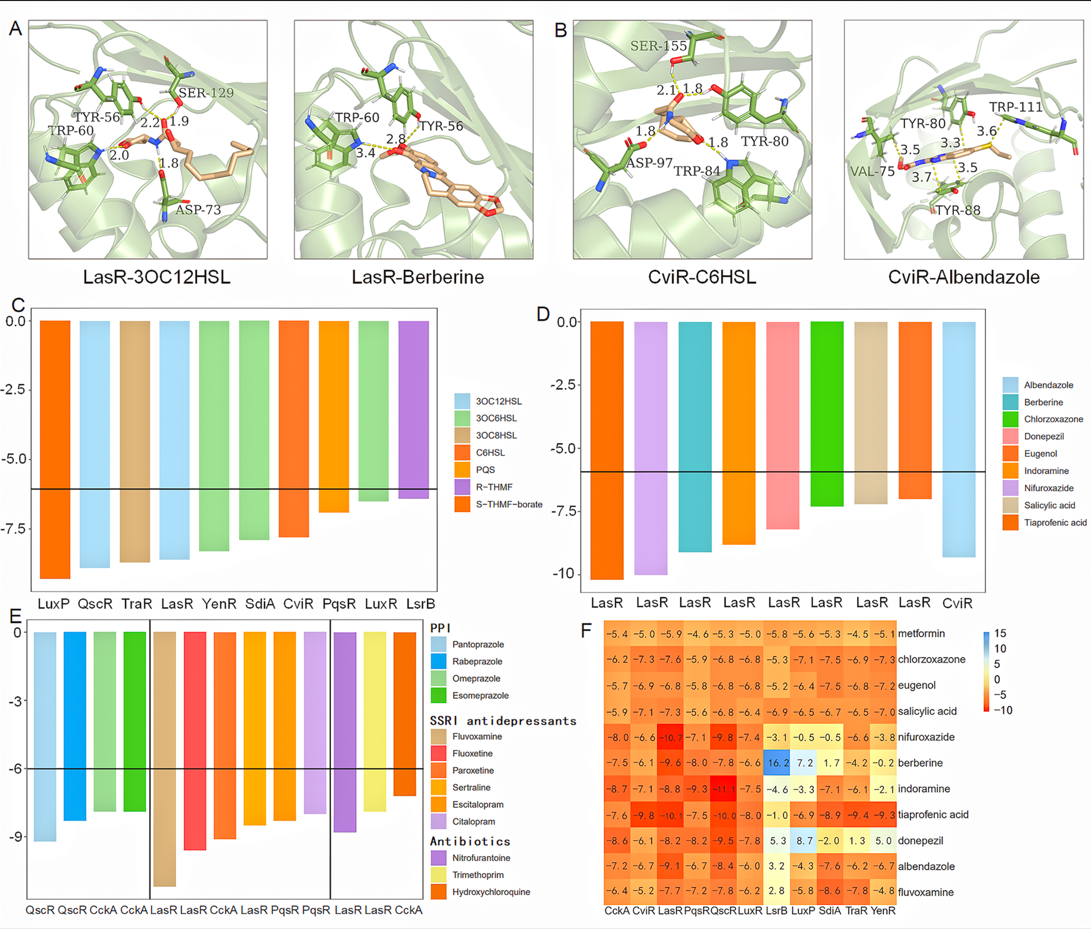
Figure 2. Analysis for the reported QS-based drug-microbe interactions. A. Binding illustration for 3OC12HSL-LasR and berberine-LasR; B. Binding illustration for C6HSL-CviR and albendazole-CviR; C-D. FBE results for the original ligands (C) and common drugs (D) binding to corresponding QS receptors; E. FBE results for the reported cases without pointing out the targets; F. Crosstalk analysis for different drug-receptor combinations.
To have a better understanding for the QS-based drug-microbe interactions at a larger scale, we conducted a docking-based calculation for FBEs distribution of the above 11 QS receptors and more than 8,000 drugs from the DrugBank database (Figure 3). In order to make the FBE distribution more detailed, we have set -8 kCal/mol, -10 kCal/mol, and -12 kCal/mol as three other cutoffs to rank the docking results in a certain gradient. Results shown that there are the most of drugs not binding to LsrB (FBE ≥ -6 kCal/mol), followed by LuxP, YenR, CviR, TraR, SdiA, LasR, QscR, LuxR (SmcR), PqsR, and CckA. Most of FBEs are located in the range of -6~-8 kCal/mol, followed by -10~-12 kCal/mol and smaller than -12 kCal/mol (Figure 3A). Excluded the non-binding cases, we have analyzed docking-based results with FBEs smaller than -6 kCal/mol (Figure 3B). There are the least drugs and weakest binding to LsrB receptor, while the most cases and strongest binding to CckA. The FBEs of the strongest cases for LasR, QscR, SdiA and TraR, are all lower than -12 kCal/mol. The above results indicate that there are changeable drug-receptor interaction strengths among different drugs and microbes.
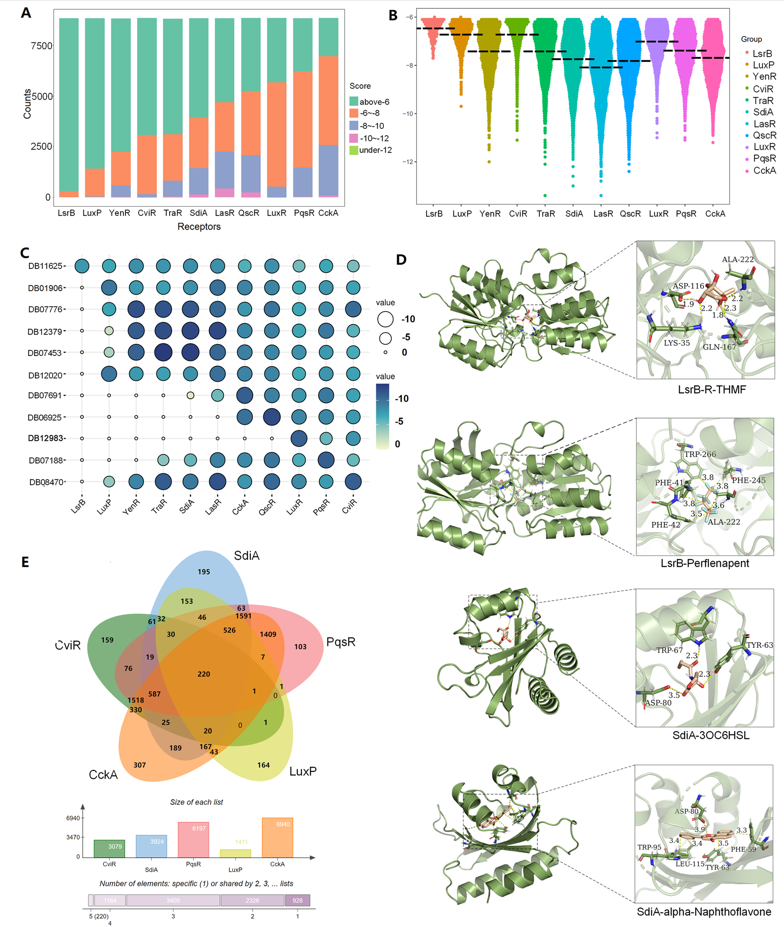
Figure 3. Analysis for various predicted drug-receptor interactions. A. Docking results distribution of 11 QS receptors and more than 8000 drug molecules; B. Docking results distribution for FBE below -6 kcal/mol; C. FBE results of the strongest binding for the screened eleven ligands and QS receptors; D. Illustration for Perflenapent and alpha-Naphthoflavone bind to LsrB and SdiA, respectively; E. Drug crosstalk results for CviR, SdiA, PqsR, LuxP, and CckA.
Experimental validations
Based on the docking-based results, we have verified some of them by surface plasmon resonance (SPR), which are commonly used to study the direct interaction between small molecules and proteins (Figure 4).

Figure 4. Experimental validations for docking-based results of LsrB and SdiA QS receptors. A. Validations for docking-based results of LsrB and three drugs (mandelic acid, aspirin, salicylic acid). B. Validations for docking-based results of SdiA and other three drugs (alpha-naphthoflavone, sulfabenzamide, and progesterone).
To have a better understanding on the drug-receptor interactions, we have shrunken the comprehensive network into a simplified network (Figure 5) with showing only common elements and specific elements like the flower for the 11 QS receptors. Note that each QS receptor has its own specific binding drug, except for the TraR receptor, and there are most of specific drugs for LuxR (73), followed by CckA (62), LuxP (54), LasR (44), PqsR (27), LsrB (26), QscR (15), SdiA (14), CviR (10), and YenR (7).

Figure 5. Illustration for the shrunken drug-receptor interaction network, which was generated using EVenn (http://www.ehbio.com/test/venn).
Drugs, microbes, and diseases are located in a complex system, where contains various drug-receptor, drug-microbe, drug-disease, receptor-microbe, and microbe-disease interactions. It is demonstrated that QS receptors can be used as potential targets for some commonly used drugs, not only affecting the efficacy of the drugs themselves, but also affecting certain diseases by affecting the abundance of specific microbes. Herein, we integrated various drugs, receptors, gut microbes, and diseases together to be a systematic framework (Figure 6A) to form a potential key knowledge map of the human gut microbiota to promote the understanding of personalized medicine and developing potential therapies for diverse diseases. Some research has also carefully collected the drug-diseases and drug-microbe, and microbe-disease causal connections, respectively. Combined with the data from the above databases and diverse lectures, we have curated various connections carefully for drugs, receptors, microbes, and diseases to form a repository of drug-based microbial interactions, which were listed in QS-DMD database.

Figure 6. Systematic framework and repository construction for drugs, microbes and diseases. A. Schematic diagram of the systematic framework; B. Cases for circle interactions among drugs, QS receptors, corresponding microbes, and relevant diseases. Note that blue lines represent various interactions, the grey line represents the abbreviated interactions, which can be searched in DrugBank database.